inFACT COVID-19 Visuals - Part 3

Written by
Patrick Manning
on 2020-04-16 in tags: COVID-19, Daily Update, Graphs

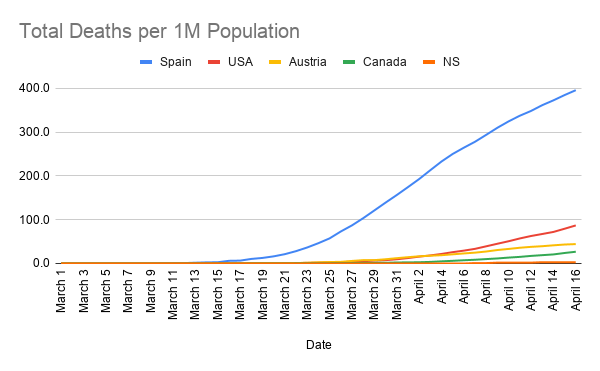
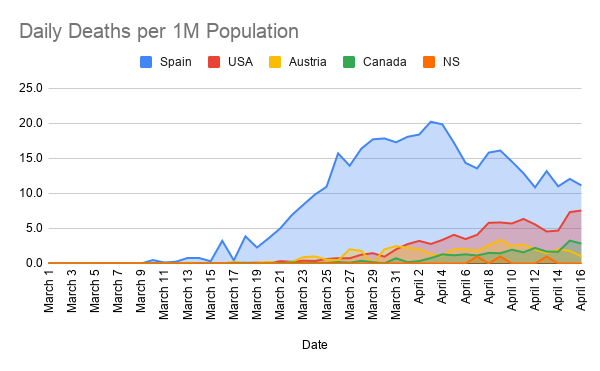
Introducing a new, 3rd measure into my framework. Here we have "Daily Deaths per 1M Population" As opposed to TOTAL deaths, like in Part 2, DAILY deaths is NOT a cumulative total, and separately plots each days deaths (per 1M population). This measure does in fact look strictly...

Full Article →

inFACT COVID-19 Visuals - Part 2

Written by
Patrick Manning
on 2020-04-16 in tags: COVID-19, Daily Update, Graphs

This one is more straight forward. As the title states, this one measures the total, cumulative deaths per 1M population over time. This is the data used to calculate the change that's plotted in Part 1. As the graph in Part 1 approaches 0, ie: the increase in...

Full Article →

inFACT COVID-19 Visuals - Part 1

Written by
Patrick Manning
on 2020-04-16 in tags: COVID-19, Daily Update, Graphs

Daily Change in Total Deaths per 1M Population This graph represents the CHANGE in TOTAL (cumulative) death rate from one day to the next. The natural occurrence for this type of data is for it to spike earlier on when the numbers are smaller and therefore more volatile. For example,...

Full Article →

COVID-19 Case Numbers are Low Quality Data

Written by
Patrick Manning
on 2020-04-16 in tags: COVID-19, Recovery, Death Rate

I've been asked on a number of occasions why I don't report on case numbers ( UPDATE - I do now report on cases for Nova Scotia due to popular demand, but this post remains accurate). This post is dedicated to explaining why: For data to be...

Full Article →
← Newer Posts
Page 9 of 9
DONATE

Connect with in-FACT

Copyright © 2020 in-FACT, All Rights Reserved | Privacy Policy Website designed by Citadel Design